 This project simulates the evolution of some simple creatures called Dots living inside a 2D plane.
Dots have two attributes: a position in the plane and a set of genes.
More precisely, a position is an
This project simulates the evolution of some simple creatures called Dots living inside a 2D plane.
Dots have two attributes: a position in the plane and a set of genes.
More precisely, a position is an x,y coordinate while a 'gene', as it were, is an x,y offset within some range.
A Dot 'expresses' a gene by applying the offset value contained within to its current position. For example if a Dot starts at position 6,6 and has a gene containing the offset value of 5,-5 then expressing this gene will offset the Dot's position to 11,1.
Every Dot has the same number of n genes and each Dot can express each of its genes exactly once. And every generation of Dots begins life at the same location: START - an x,y coordinate in the 2D plane. In this way, a Dot can move through its 2D world some finite distance from the START.
A Dot's only purpose in life is to move from START and reach the GOAL - another x,y coordinate somewhere in the 2D plane.
Since a Dot has n genes it only has n moves that it can make to reach the GOAL.
The object of this simulation is to selectively breed Dots with a set of genes which take the Dots on the shortest path from the START to the GOAL.
Broadly speaking, the program can be summarized as follows:
- breed initial Dots
- express all Dot genes
- evaluate fitness of current generation
- create mating pool
- breed new generation of Dots
- loop from step 2
ntimes
#Setup
x,y offset values within some range.
The 'range' here refers to the minimum to maximum step distance we want the Dots to be able to make.
We could give offset values to the Dots that are big enough to take them to the GOAL in a single step, but this would make things a bit trivial. In order to make things a bit more interesting, the simulation gives small offset values to Dots forcing the Dots to accrue as many of the best offset values as possible in order to make it an appreciable distance to the GOAL.
Here is a example of a path a first generation Dot might take:
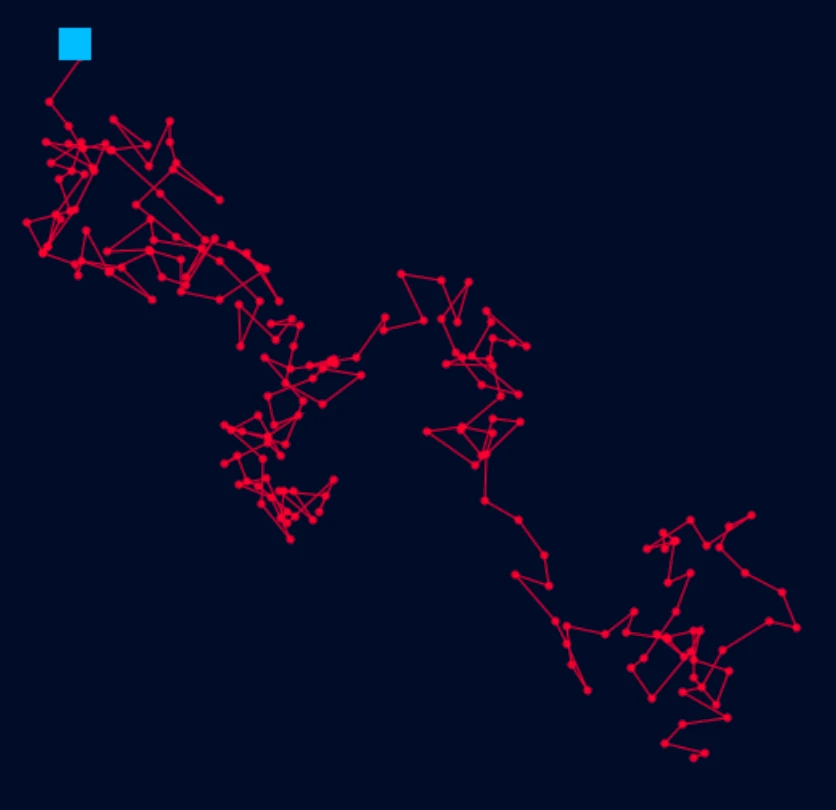 In the above image the blue square represents the
 START position and the red line represents the path the Dot took from the START position.
Each red line segment here connected to a red dot represents an expressed gene. Even the maximum distance the Dot traveled in a single step is relatively small here.
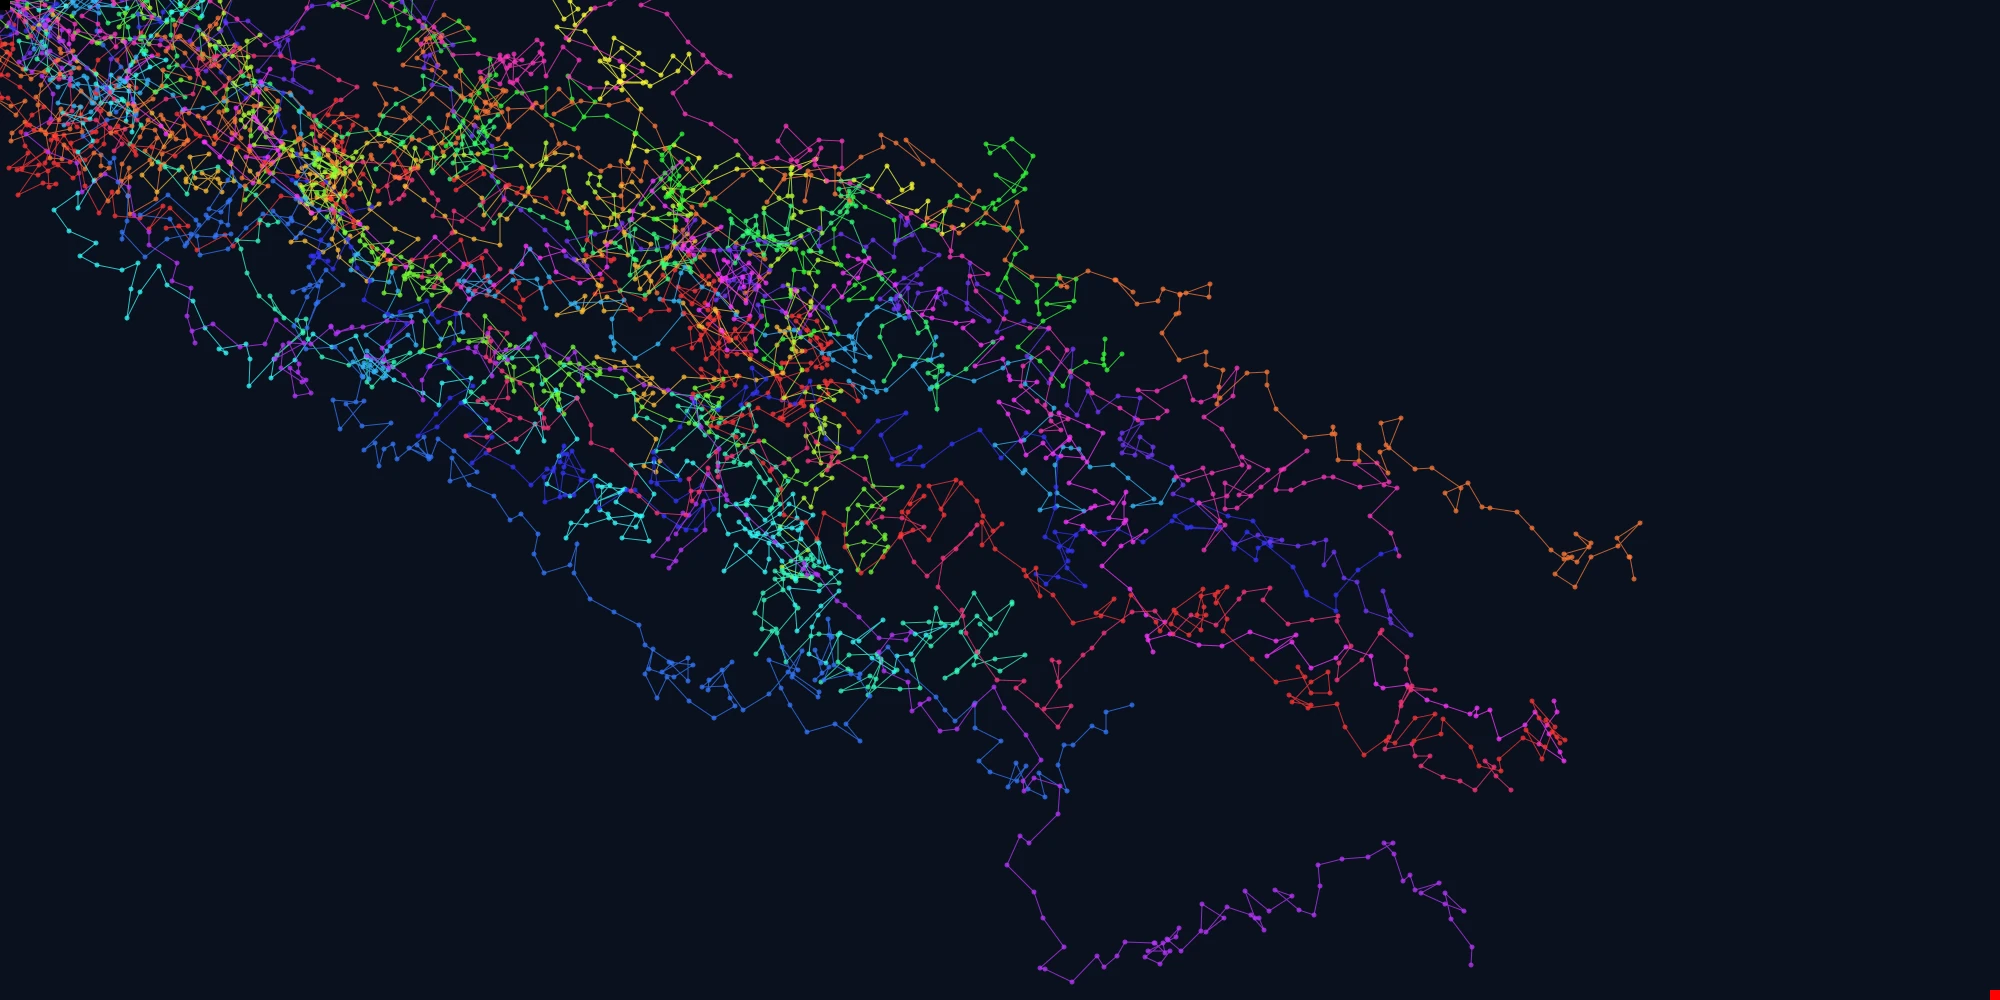
The final positions of Dots from the first generation is, as you might expect, a pretty random distribution of squiggly lines radiating from START.
#Fitness
GOAL relative to each other Dot. The closer a Dot is to the GOAL compared with its peers the higher its fitness weighting.
With this definition of fitness in mind let's consider the following comparison image of two Dot paths:
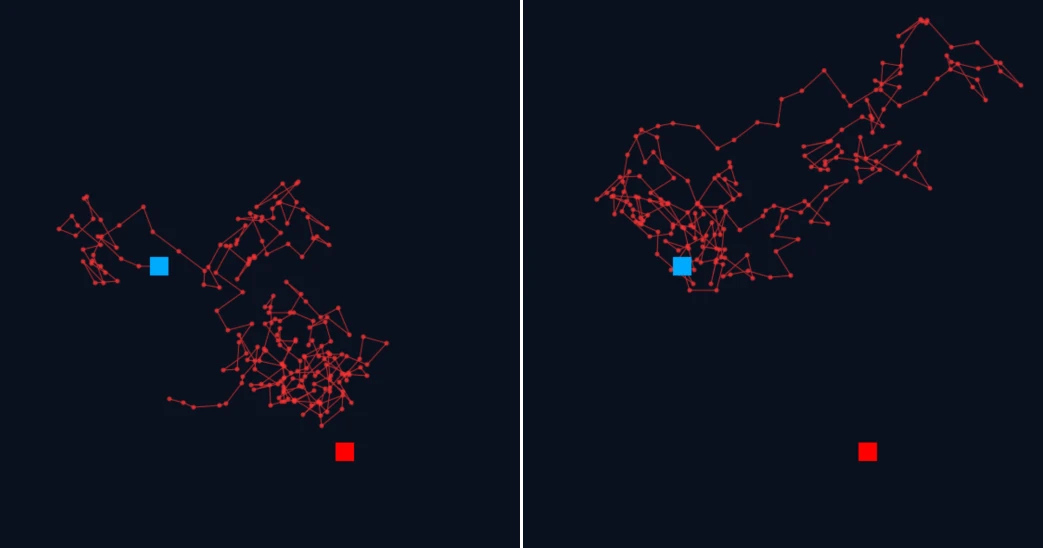 As before, the
 START is represented by a blue square while the GOAL is represented by a red square. The dot path depicted in the left image would be considered fitter by our working definition compared with its right image counterpart because its final position is closer to the red square.
Once all Dots from the current generation have been awarded a fitness weight, the program proceeds to the Selection phase.
#Selection
#Reproduction
#Mutation
GOAL.
On their own then, selection & reproduction will eventually lead to the species becoming a genetic monoculture which leads to evolutionary stagnation.
To mitigate this, the program introduces some artificial mutation during the reproduction phase by occasionally splicing a mutant gene into an offspring's genome.
A mutant gene takes the form of another x,y offset value within some predefined range.
Introducing mutant genes into the gene pool means that potentially fitter genes (than those currently available) can arise within the species, undergo selection and gradually proliferate, helping the Dots get closer and closer to the GOAL
Controlling the rate of mutation is key here as we don't want to introduce too many mutant genes too rapidly because this can overwhelm the gene pool with noise. Our object, rather, is to introduce mutant genes at a gradual pace, allowing enough time for the new genes to have some effect on the wider population.
The program controls the rate of mutation via a constant called the MUTATION_RATE so that it can doll out mutant genes at a rate that is beneficial to the species.
#Rinse and repeat
GOAL.
To demonstrate this, below are four snapshots of the path taken by the fittest Dot from the 1st, 4th, 8th and 20th generation of Dots from an example simulation:
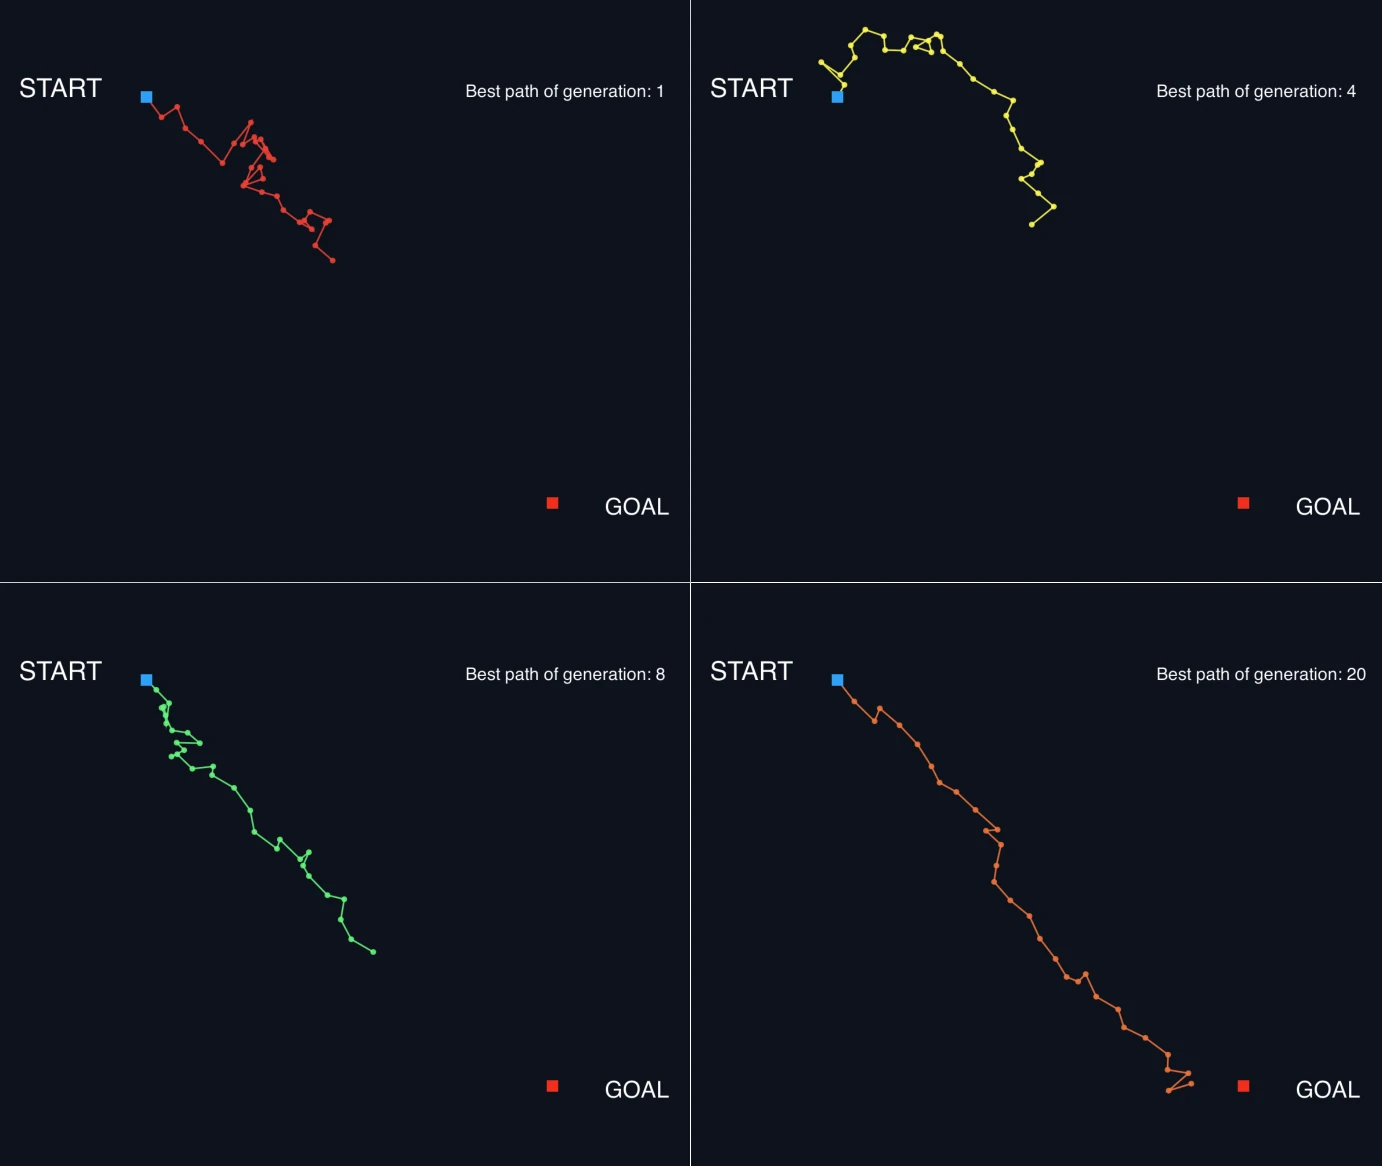 In this particular simulation, each generation consisted of 200 Dots where each Dot had 30 genes.
We can observe here a general improvement across the generations as the genes that take the Dots in whacky in-direct paths are slowly filtered out of the gene pool, replaced by genes that take the Dots in a straighter line from the
In this particular simulation, each generation consisted of 200 Dots where each Dot had 30 genes.
We can observe here a general improvement across the generations as the genes that take the Dots in whacky in-direct paths are slowly filtered out of the gene pool, replaced by genes that take the Dots in a straighter line from the START to the GOAL.
If you're interested in learning more, check out the code here.Some of the tech I worked with on this project: